GMN Overview
Network structure is a foundation of complex systems as demonstrated in genomic (Turner 2014), metabolic (Jeong 2001), physiologic (Bashan 2012), social, and neural systems/networks (Bae 2025,Assaf 2020). Networks often express low-dimensional structure within a high-dimensional system consistent with the manifold hypothesis (Thibeault 2024) evidenced in living systems (Eckmann 2021) and their neural processing (Fontenele 2024). The fact that fantastically complex structures such as mammalian brains express function and behavior not as single, ultra high-dimensional objects, but as interacting networks suggests the computational architecture should encompass low-dimensional, multiscale, interacting networks.
Generative manifold networks (GMN) combine these essential features into a new architecture based on interactive dynamical manifolds. GMN networks are discovered through an interaction function between observables defining an adjacency matrix from which a network graph for a desired target observable is grown. The interaction function can be a metric of causality such as convergent cross mapping (CCM) (Sugihara 2012), mutual information, nonlinearity (Sugihara 1994,Smith 2015,Pao 2021,) or other suitable interaction metric. Each node of the network is a multivariate state space manifold driven by observables leveraging the power of generalized embedding (Deyle 2011). The architecture is therefore simple, low-dimensional and observable.
GMN can be used to discover manifold networks underlying complex, nonlinear dynamical systems toward understanding and prediction of their internal states and behaviors (Park et al. 2026).
Manifold Representation
Many state-space analytic methods presume the state-space can be represented as an invariant manifold completely encapsulating the system dynamics. Another common presumption is that a diffeomorphic representation of the true manifold can be derived from Takens embedding of a univariate time series observed from the system. In practice, univariate observations may not sufficiently encapsulate the underlying dynamics, an issue that is compounded as dimensionaliy and complexity of the dynamics increase.
In cases where the dynamics arise from a complex interaction network, the realities of partial observation imply that univariate reconstructions from various time series of the system may not provide a diffeomorphic representation of a global underlying manifold. Instead, decomposing the system into an interacting network of manifolds may better represent the underlying dynamics.
Network Determination
Manifold network structure is discovered using an interaction matrix quantifying interactions between all observables.
Interaction Matrix
Given a data set with N observation vectors the interaction matrix (iMatrix) is an NxN matrix with each entry quantified by application of an interaction function F() between all combination of observables.
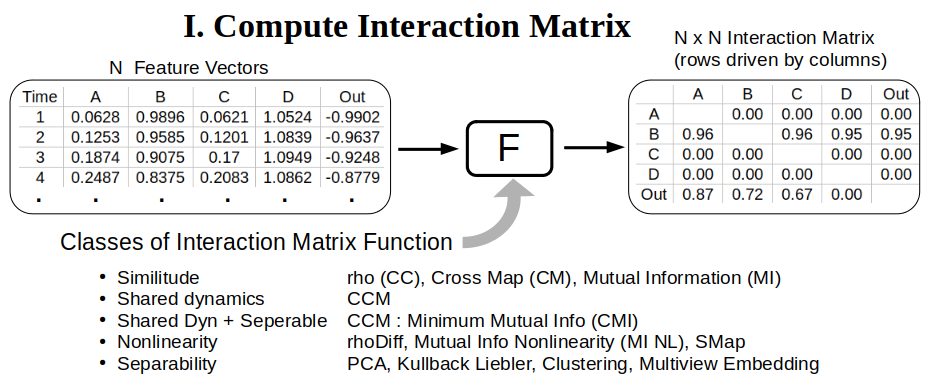
The application program InteractionMatrix.py can create interaction matrices using a variety of interaction functions F().
Available functions include :
| Method | Label | argument |
|---|---|---|
| Cross Correlation | CC | -rho |
| Simplex Cross Map | CM | -cmap |
| Convergent Cross Map | CCM | -ccm |
| rho Diff = max(CM, 0) - abs(CC) | rhoDiff | -rhoDiff |
| Mutual Information | MI | -mi |
| Mutual Information Non Linearity | MI_NL | -nl |
| SMap nonlinearity | SMap | -smap |
| CCM : Mutual Information | CMI | -cmi |
A natural choice for the interaction function F() is convergent cross mapping (CCM) since CCM validates that the two variables are part of the same dynamical system. Results are stored in a Python pickled dictionary of pandas dataFrames or output as .csv files. See the docstring in InteractionMatrix.py.
Network Creation
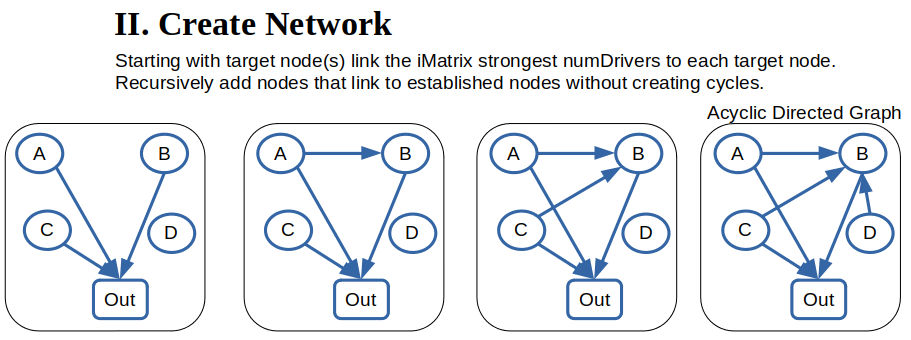
Once an interaction matrix is defined the application program CreateNetwork.py builds the GMN network as a networkx acyclic directed graph (DiGraph). Nodes are added recursively starting at the output node(s) adding links according to the network interaction matrix while disallowing creation of network cycles. The network is stored in a Python dictionary with keys Graph : the networkx DiGraph, and Map : a Python dictionary of node names.
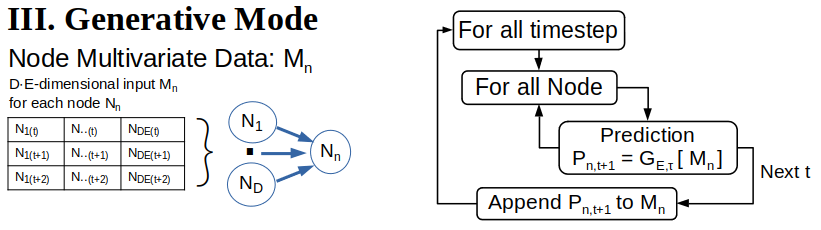
Generative Mode
Each Node consists of a low-dimensional state-space manifold with an output corresponding to an observation vector. Given the network and observation vectors a GMN class object is created and initialized according to a configuration file.
import gmn
G = gmn.GMN( configFile = 'config/default.cfg' )
The network is run in generative mode to generate time series at all nodes:
G.Generate()